EducationAug 30, 20269 min read
Lire en français·Auf Deutsch lesen·Leer en español·Przeczytaj po polsku
Smart Scales and BIA: How Accurate Are They Really?
Your smart scale says 18 percent body fat on Monday and 22 percent on Thursday, and you have not changed. Here is how bioelectrical impedance actually works, what the research says about its accuracy, and the narrow job it can still do well.
Reviewed by the HyperBody team

Key takeaways
- How accurate are smart scales for body fat?
- Consumer BIA scales can plausibly miss your true body fat by several points in either direction, and two scales can disagree while both differing from a reference method. Reviews conclude BIA performs reasonably only in normally hydrated adults who resemble the calibration population, degrading with abnormal hydration or a different build.
- Why does my smart scale body fat change so much day to day?
- BIA measures water-dependent conductivity, not fat. Dehydration raises impedance and reads as more fat; salty meals, alcohol, workouts, menstrual-cycle shifts, time of day, food in your gut, and foot placement all move the estimate without any real fat change. A four-point swing in three days is hydration, not fat.
- How should I use a smart scale correctly?
- Measure first thing in the morning after the bathroom, before food or water, on the same scale on a hard floor. Use weekly averages instead of daily readings, respect only moves that persist two to three weeks, and never compare numbers across devices or after toggling athlete mode.
- Is a smart scale better than DEXA or photo analysis?
- DEXA is far more precise but costly and impractical to repeat monthly. BIA tracks direction under standardized conditions but cannot say where your muscle is. Photo-based analysis is immune to hydration noise and returns muscle-by-muscle scores, which tells you what to train, something a single percentage never does.
You step on your smart scale on Monday and it says 18 percent body fat. Thursday, after a salty dinner and a bad night of sleep, it says 22. You did not gain four percentage points of fat in three days; that would require a caloric surplus so large it would have its own weather. Something else is going on, and understanding what makes the difference between a gadget that quietly misleads you and a tool you can use for the one job it is actually good at.
Smart scales estimate body composition using bioelectrical impedance analysis, or BIA. The technology is genuinely clever, decades old, and well studied. It is also widely misunderstood by the people standing on it. This article explains how BIA works in plain language, why the readings swing so much, what the research concluded about its accuracy, and the protocol to follow if you keep using one.
How Bioelectrical Impedance Actually Works
A BIA scale does not see fat. It measures electricity. When you stand on the metal pads, the scale sends a tiny, imperceptible electrical current up one leg and down the other, and measures the opposition that current encounters on the way: the impedance.
The useful physiological fact is that the tissues in your body conduct electricity very differently. Lean tissue, muscle especially, is around three-quarters water and rich in electrolytes, so current flows through it easily. Fat tissue holds much less water and resists the current. Higher impedance therefore suggests proportionally more fat in the path the current traveled; lower impedance suggests more lean mass.
But impedance alone is just a number in ohms. To turn it into a body fat percentage, the scale feeds that number into a prediction equation along with the data you typed in at setup: height, weight, age, sex, and sometimes an "athlete mode" flag. Those equations were built by calibrating impedance readings against reference methods in specific study populations. The scale is not measuring your body fat; it is predicting it, by assuming your body is hydrated like, shaped like, and distributed like the average person in the calibration sample. Every assumption in that chain is a place where error gets in. A foot-to-foot scale adds one more: the current takes the lowest path through your legs and pelvis and largely skips your torso and arms, so the scale is extrapolating your whole-body composition from your lower half.
Why the Reading Swings So Much
Once you know the scale is measuring water-dependent conductivity, the wild swings stop being mysterious.
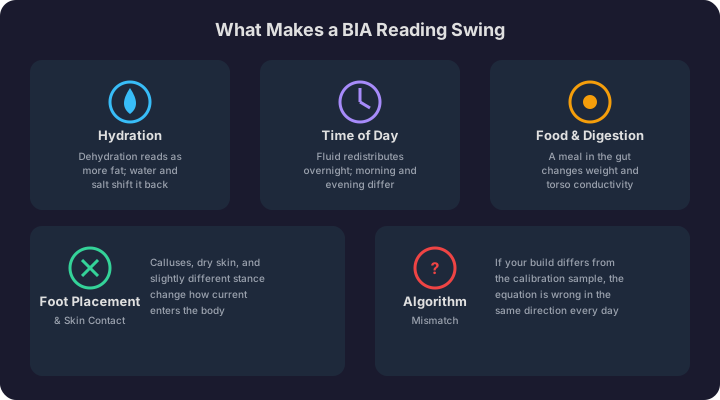
Hydration is the big one. Dehydration raises impedance, which the equation reads as more fat. Drink two glasses of water and the estimate can drop. A salty meal causes water retention and shifts the number the other way. Alcohol the night before, a hard sweaty workout, even the hydration swing across a menstrual cycle: all of it moves the estimate without a gram of actual fat changing.
Time of day matters for the same reason. Overnight, fluid redistributes through your body, and your hydration drifts as you sleep without drinking. A morning reading and an evening reading are two different measurements of two different fluid states.
Food and digestion add noise too: a meal in your gut changes both your weight and the conductive contents of your torso. So does foot placement and skin contact, since calluses, dry skin, and slightly different stance positions change how the current enters. And underneath all of it sits the algorithm itself: if your build differs from the calibration population, say you carry more muscle than average, the equation can be systematically wrong for you in the same direction every single day. Athlete modes attempt to patch this with a different equation, which is also why toggling that one setting can instantly "change" your body fat by several points.
What the Research Says
None of this is news to researchers. In 2004, an expert group led by Kyle published a comprehensive two-part review of BIA principles and methods in Clinical Nutrition, and its conclusions remain the standard reference: BIA can perform reasonably in healthy, normally hydrated adults who resemble the population the prediction equation was derived from, but accuracy degrades when hydration is abnormal or when the person differs from that reference population, and results depend heavily on which equation the device uses1.
A 2008 review by Dehghan and Merchant examined whether BIA is accurate enough for large epidemiological studies and reached a similar verdict from a different angle: BIA's accuracy is constrained by exactly the factors above, hydration status, recent eating and exercise, and the validity of the prediction equation for the population being measured, and the authors emphasized standardizing measurement conditions because the raw readings are so sensitive to them2.
Translated out of the literature: a consumer foot-to-foot scale can plausibly miss your true body fat percentage by several points in either direction, and two different scales can disagree with each other while both disagreeing with a reference method. The error is not random gadget flakiness; it is structural, baked into what impedance can and cannot know about you.
Trends, Not Truths
Here is the reframe that makes a smart scale worth keeping: it is a poor instrument for absolute body fat and a passable instrument for direction, if and only if you standardize conditions.
The absolute number depends on the equation, and the equation's assumptions about you do not change. But if you measure under the same conditions every time, the assumption error stays roughly constant, and changes in the reading start to reflect changes in you. A scale that reads 21 percent when the truth is 17 is wrong; a scale that drifts from 21 to 19 over ten weeks of dieting under identical conditions is probably telling you something real about the direction you are heading, even though both endpoints are off.
This is the same trend-versus-snapshot logic that applies to every body composition method, including the expensive ones. The question worth asking of any tool is not "is this number true?" but "does this number move faithfully when my body changes?"
How BIA Compares to DEXA and Visual Assessment
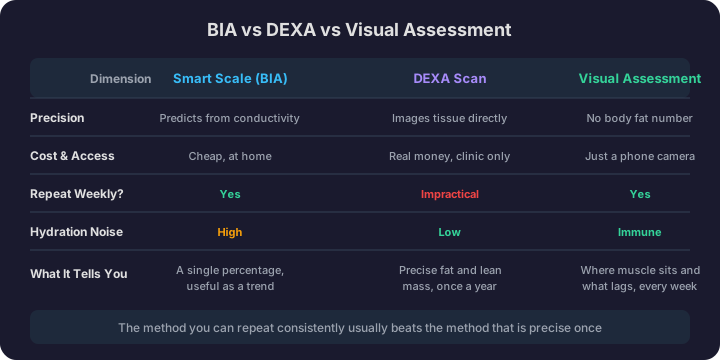
DEXA is the clinical reference most often used to judge BIA, and the comparison is not close on precision: DEXA images your tissue directly rather than inferring it from conductivity, which is why validation studies treat it as the benchmark. But DEXA costs real money per scan, lives in a clinic, and is impractical to repeat monthly, which means most people get one data point a year from it. We covered that trade-off in depth in our comparison of AI physique analysis and DEXA scans; the short version is that the method you can repeat consistently usually ends up more useful than the method that is more precise once.
Visual assessment is the other alternative, and it answers a question BIA cannot. A single body fat percentage, even a perfectly accurate one, says nothing about where your muscle is, which side is lagging, or whether your shoulders are keeping pace with your back. Photo-based analysis works from what your physique actually looks like: HyperBody's AI physique rater takes five standardized photos and returns a body fat estimate alongside muscle-by-muscle development scores and proportion analysis. It is an estimate too, no photo method escapes that, but it is immune to the hydration noise that whipsaws BIA, and it tells you what to do in the gym, which a single percentage never does. For physique decisions, that is usually the more useful shape of answer.
The Protocol If You Keep Using One
A smart scale you already own can still earn its spot on the bathroom floor. The rules:
Measure at the same time, every time. First thing in the morning, after the bathroom, before food, water, or coffee. This is the most controllable hydration state you have.
Keep conditions boring. Same scale, same spot on a hard floor, bare feet, same stance. Skip the reading entirely after a night of alcohol, an unusually salty day, or an illness, because you already know what corrupted it.
Use weekly averages, not daily readings. Daily body fat numbers from BIA are noise wrapped around a faint signal. Average the week, compare week to week, and only respect moves that persist for two to three weeks.
Never compare across devices or modes. A new scale, a friend's scale, a gym's handheld unit, or a toggled athlete mode is a new equation and a new baseline. If you replace your scale, expect the absolute number to jump and start the trend over from week one. Trends only count within one device, one mode.
Track the trend next to other evidence. Scale weight trend, photos, gym performance, and how clothes fit. When the BIA trend agrees with the rest, believe it sooner.
When to Ignore It
Some situations make BIA readings not just noisy but meaningless, and the right response is to discount them entirely. During the first weeks of a new diet, large water shifts dominate everything the scale sees. During a muscle-building phase, modest fat gain plus muscle gain plus higher food volume can push the percentage around in ways that say nothing about your actual ratio. After travel, illness, a heavy training block, or anything else that disturbs fluid balance, give it a week before you look again.
And if the number has become something you check twice a day and feel bad about, ignore it on principle. A measurement that swings four points on hydration is not worth a minute of mood, let alone a diet decision made at 11 p.m.
The Bottom Line
A smart scale is a hydration-sensitive prediction machine wearing the costume of a measurement device. The research is consistent: useful in standardized conditions for people who resemble its calibration assumptions, structurally unable to promise an accurate absolute body fat percentage for any individual. Treat its output accordingly. Standardize your conditions, average the week, trust direction over digits, and cross-check it against evidence that can see what impedance cannot: your photos, your lifts, and a method that actually looks at your physique. The scale can tell you which way you are drifting. It was never going to tell you what you are made of.
References
Footnotes
-
Kyle UG, Bosaeus I, De Lorenzo AD, Deurenberg P, Elia M, Gomez JM, Heitmann BL, Kent-Smith L, Melchior JC, Pirlich M, Scharfetter H, Schols AM, Pichard C (2004). Bioelectrical impedance analysis, part I: review of principles and methods. Clinical Nutrition, 23(5), 1226-1243.
-
Dehghan M & Merchant AT (2008). Is bioelectrical impedance accurate for use in large epidemiological studies? Nutrition Journal, 7, 26.
More field notes.

AI Physique Analysis vs DEXA Scan: Accuracy, Cost, and When Each Makes Sense
DEXA is the clinical gold standard. AI photo analysis costs nothing to start and you can run it monthly. Here's an honest comparison of accuracy, price, and what each one actually tells you.

What Body Fat Percentage Actually Looks Like (Male & Female)
Everyone talks about body fat percentage, but few people know what different levels actually look like. Here's a realistic, no-BS guide to what each range means for your physique.

Golden Ratio Physique: Shoulder-to-Waist Ratio and the V-Taper, Explained
The golden ratio physique claims the ideal shoulder-to-waist ratio is 1.618. Here is what attractiveness research actually supports, how to measure your own ratio, and how to train toward a wider-looking frame.
More on HyperBody